Construction management in depth
4D/5D construction simulation in depth
What 4D and 5D mean, how we link building model, schedule and cost, and what the simulation delivers during construction.
1From 3D to 4D and 5D
2Approach
Check and structure the model
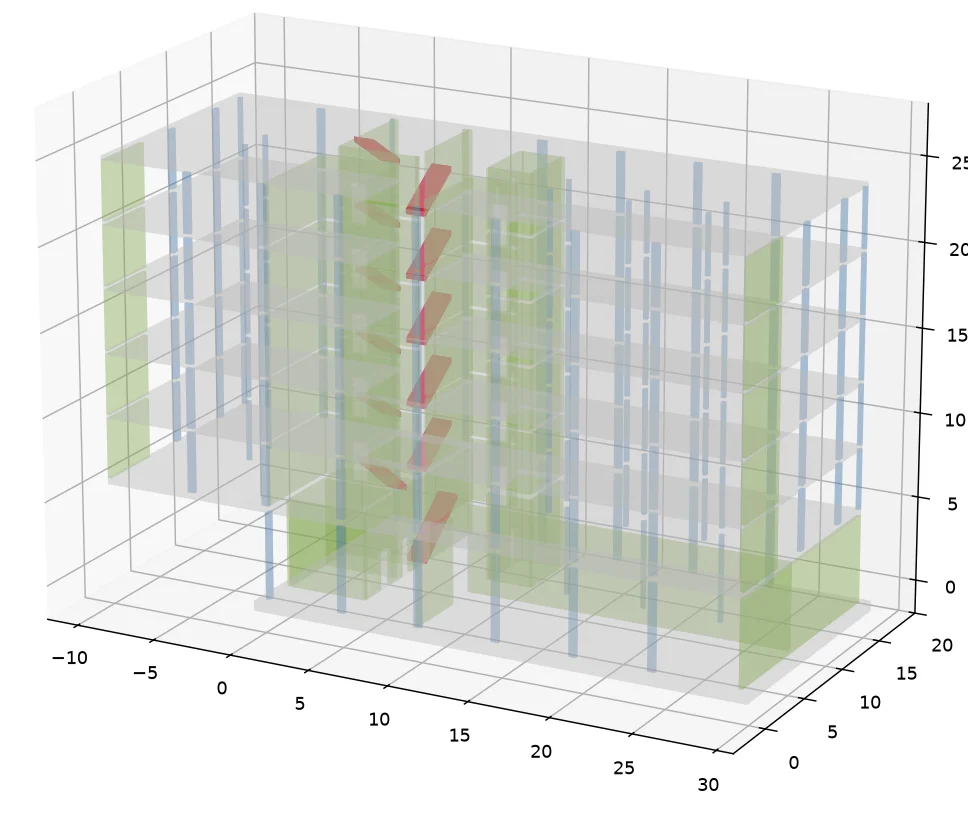
Check the IFC model for completeness, structure elements by storey, element class and section.Link elements and activities
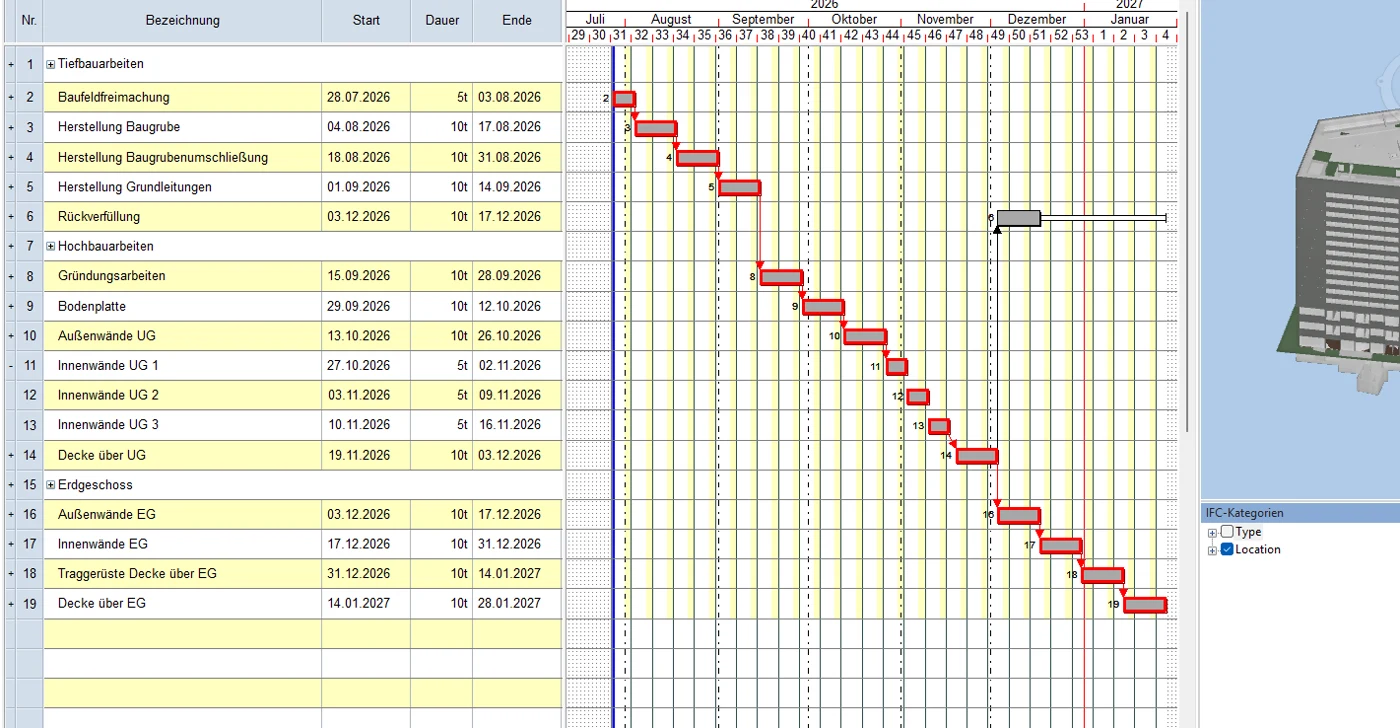
Rule-based assignment instead of manual one-by-one linking, traceable and quick to update.Simulate and check plausibility
Check sequence, takt, crane and site setup over time; reveal spatial-temporal conflicts.Assign and analyse cost
Attach resources and prices per activity and derive cost curves over the construction period.
34D: seeing the sequence
45D: cost over time
Once the schedule carries resources and cost rates, the cost curve follows directly from the construction sequence. It shows when which costs arise and is the basis for cash-flow planning, liquidity control and valuing schedule deviations.
Cost per month
Labour, plant and material cost from the resource-loaded schedule, spread over working days
Show values as table
| Month | Cost | cumulative | labour hours |
|---|---|---|---|
| February 2026 | €31,652 | €31,652 | 166 |
| March 2026 | €147,133 | €178,785 | 1,883 |
| April 2026 | €113,021 | €291,806 | 2,003 |
| May 2026 | €96,470 | €388,276 | 1,597 |
| June 2026 | €96,089 | €484,365 | 1,730 |
| July 2026 | €104,622 | €588,987 | 1,795 |
| August 2026 | €69,555 | €658,542 | 1,179 |
| September 2026 | €77,203 | €735,745 | 1,224 |
| October 2026 | €77,986 | €813,731 | 1,238 |
| November 2026 | €71,814 | €885,545 | 1,223 |
| December 2026 | €65,200 | €950,745 | 981 |
| January 2027 | €54,766 | €1,005,511 | 837 |
| February 2027 | €49,659 | €1,055,170 | 780 |
| March 2027 | €61,284 | €1,116,454 | 957 |
| April 2027 | €59,069 | €1,175,523 | 912 |
| May 2027 | €52,484 | €1,228,007 | 772 |
| June 2027 | €54,034 | €1,282,041 | 879 |
| July 2027 | €59,713 | €1,341,754 | 908 |
| August 2027 | €57,042 | €1,398,796 | 851 |
| September 2027 | €54,598 | €1,453,394 | 908 |
| October 2027 | €28,062 | €1,481,456 | 443 |
Cumulative cost (cost curve)
Running total of the monthly values, the typical S-curve of cash outflow
5Quality and documentation during construction
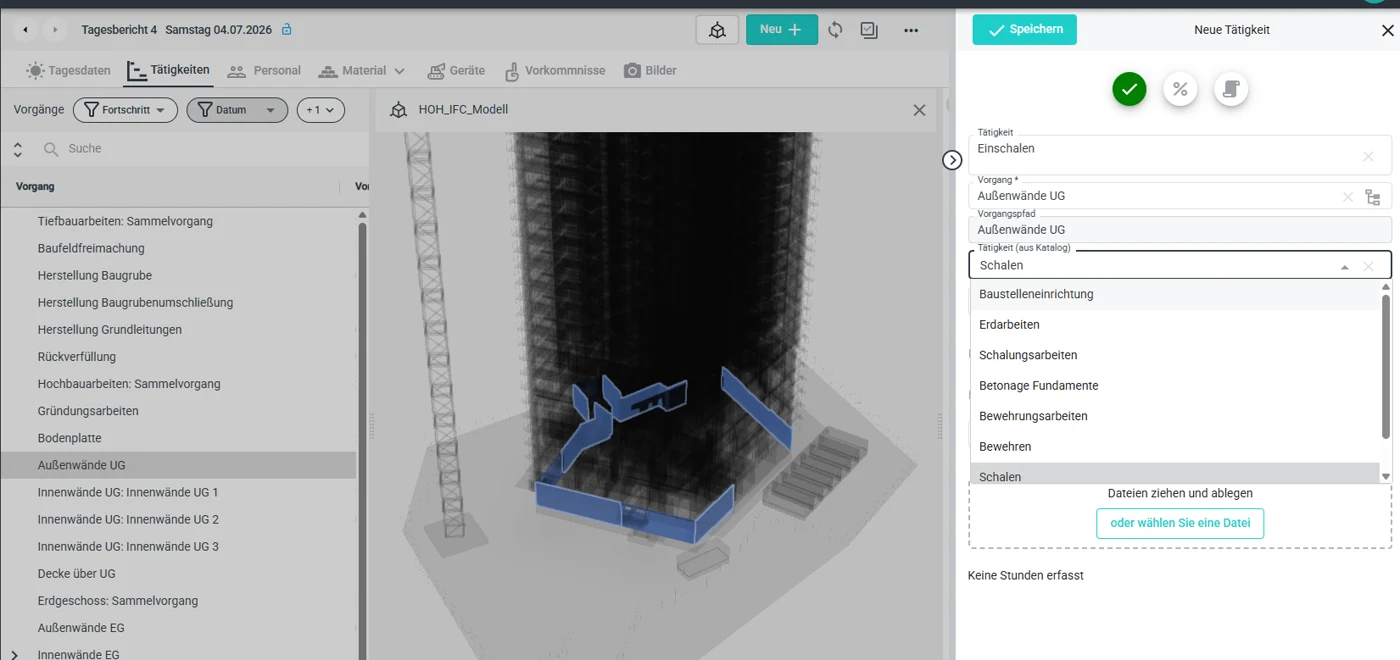
The 4D model also accompanies construction. If daily reports are captured on the model (activities, staff and plant per element), the result is complete, spatially referenced documentation.
It supports progress control, valuation and quality assurance: inspections, acceptances and defects can be assigned to the element concerned and tracked to completion.