Construction management in depth
Opportunity and risk management in depth
How schedule and cost risks can be quantified: terms, approach and Monte Carlo simulation on the example project.
1Opportunity, risk, uncertainty
Not every uncertainty is a risk. Deviations can be assessed when their impact and probability can be estimated: positive ones as opportunities, negative ones as risks. This distinction is the starting point of every robust risk analysis.
| deviation unknown | positive deviation expected | negative deviation expected | ||
|---|---|---|---|---|
| Ignorance | Ambiguity | Opportunity | Risk | |
| Impact known | no | not fully | yes | yes |
| Probability of occurrence known | no | no | yes (objective or subjective) | yes (objective or subjective) |
2Approach
Identify
Capture opportunities and risks for schedule, cost and quality with the project team.Assess
Estimate impact and probability, qualitatively or through distributions.Simulate
Aggregate individual risks in the schedule or estimate into an overall statement.Control
Define measures and contingencies and monitor their effect as the project progresses.
3Probabilistic simulation
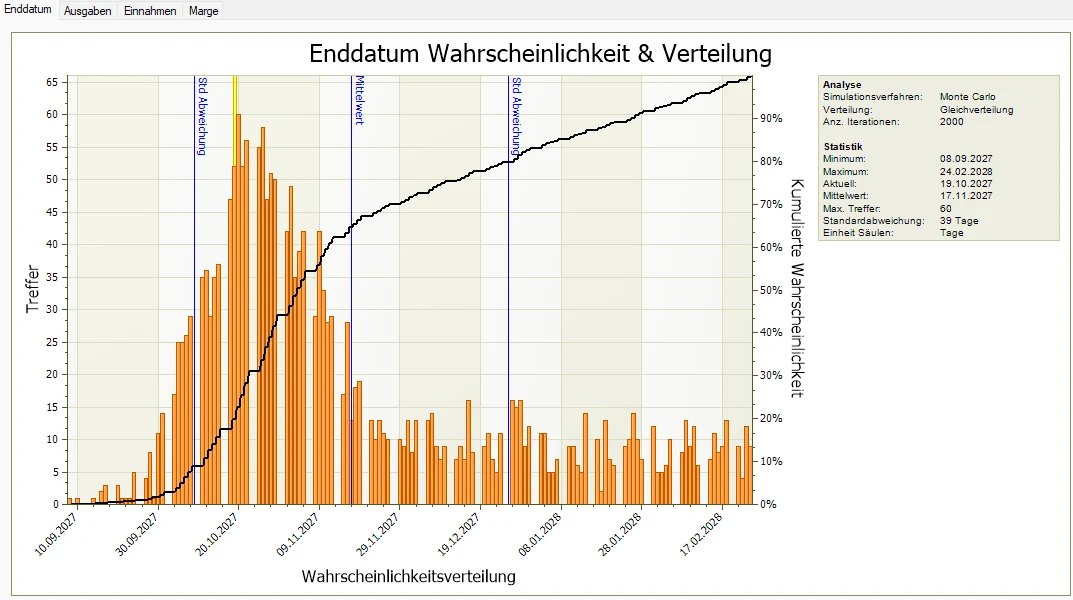
In Monte Carlo simulation every activity receives a range instead of a single value. Many simulated construction sequences yield the distribution of the result and with it a statement on how likely a date or budget will be met. The simulation below can be re-run directly in your browser.
Frequency distribution of total effort
Number of simulation runs per class (class width 500 h)
Cumulative distribution (probability of not exceeding)
Probability that total effort does not exceed a value
Convergence of the median
Running median over the first 1,000 simulation runs
Show values as table
| Class [h] | Runs | cumulative |
|---|---|---|
| 15,500 - 16,000 | 1 | 0 % |
| 16,000 - 16,500 | 1 | 0 % |
| 16,500 - 17,000 | 16 | 0 % |
| 17,000 - 17,500 | 29 | 1 % |
| 17,500 - 18,000 | 68 | 2 % |
| 18,000 - 18,500 | 81 | 4 % |
| 18,500 - 19,000 | 124 | 6 % |
| 19,000 - 19,500 | 139 | 9 % |
| 19,500 - 20,000 | 169 | 13 % |
| 20,000 - 20,500 | 183 | 16 % |
| 20,500 - 21,000 | 231 | 21 % |
| 21,000 - 21,500 | 213 | 25 % |
| 21,500 - 22,000 | 230 | 30 % |
| 22,000 - 22,500 | 248 | 35 % |
| 22,500 - 23,000 | 274 | 40 % |
| 23,000 - 23,500 | 257 | 45 % |
| 23,500 - 24,000 | 272 | 51 % |
| 24,000 - 24,500 | 252 | 56 % |
| 24,500 - 25,000 | 222 | 60 % |
| 25,000 - 25,500 | 215 | 65 % |
| 25,500 - 26,000 | 205 | 69 % |
| 26,000 - 26,500 | 199 | 73 % |
| 26,500 - 27,000 | 221 | 77 % |
| 27,000 - 27,500 | 170 | 80 % |
| 27,500 - 28,000 | 165 | 84 % |
| 28,000 - 28,500 | 149 | 87 % |
| 28,500 - 29,000 | 122 | 89 % |
| 29,000 - 29,500 | 108 | 91 % |
| 29,500 - 30,000 | 91 | 93 % |
| 30,000 - 30,500 | 81 | 95 % |
| 30,500 - 31,000 | 69 | 96 % |
| 31,000 - 31,500 | 43 | 97 % |
| 31,500 - 32,000 | 46 | 98 % |
| 32,000 - 32,500 | 34 | 99 % |
| 32,500 - 33,000 | 23 | 99 % |
| 33,000 - 33,500 | 18 | 99 % |
| 33,500 - 34,000 | 14 | 100 % |
| 34,000 - 34,500 | 8 | 100 % |
| 34,500 - 35,000 | 6 | 100 % |
| 35,000 - 35,500 | 2 | 100 % |
| 35,500 - 36,000 | 1 | 100 % |
4Schedule risks in the network
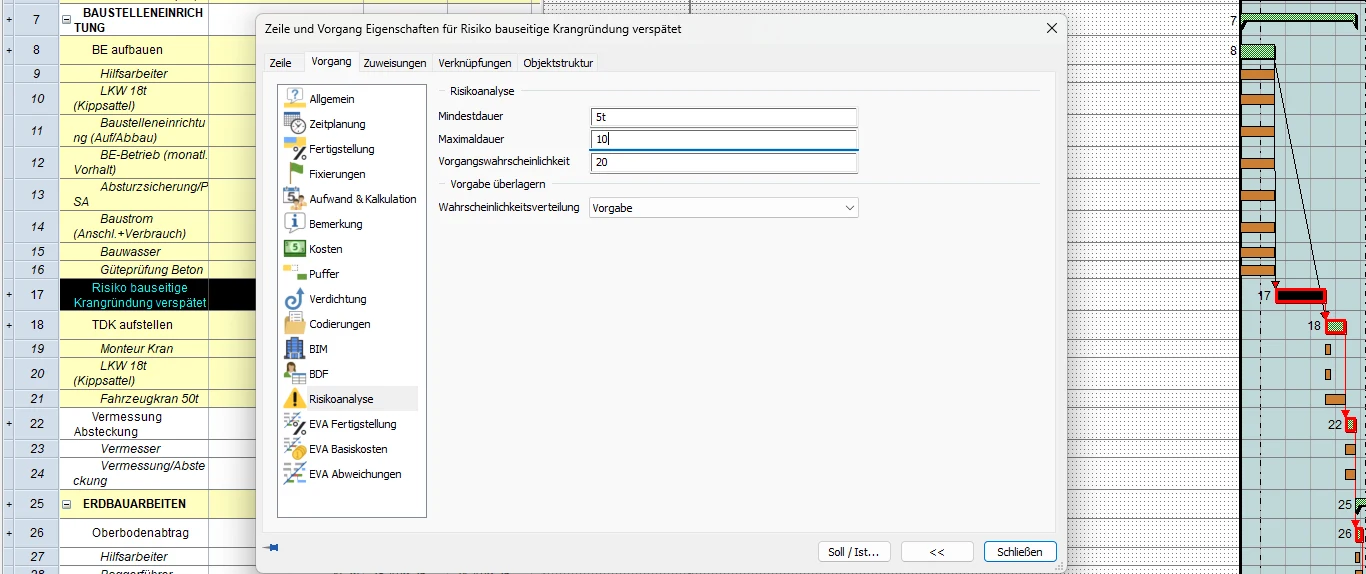
We apply the same principle directly to the network. Besides ranges per activity we model project-specific risks as events of their own, such as late preceding work or deliveries, and show their effect on the completion date.